
Browse frequently asked questions about Dashboard
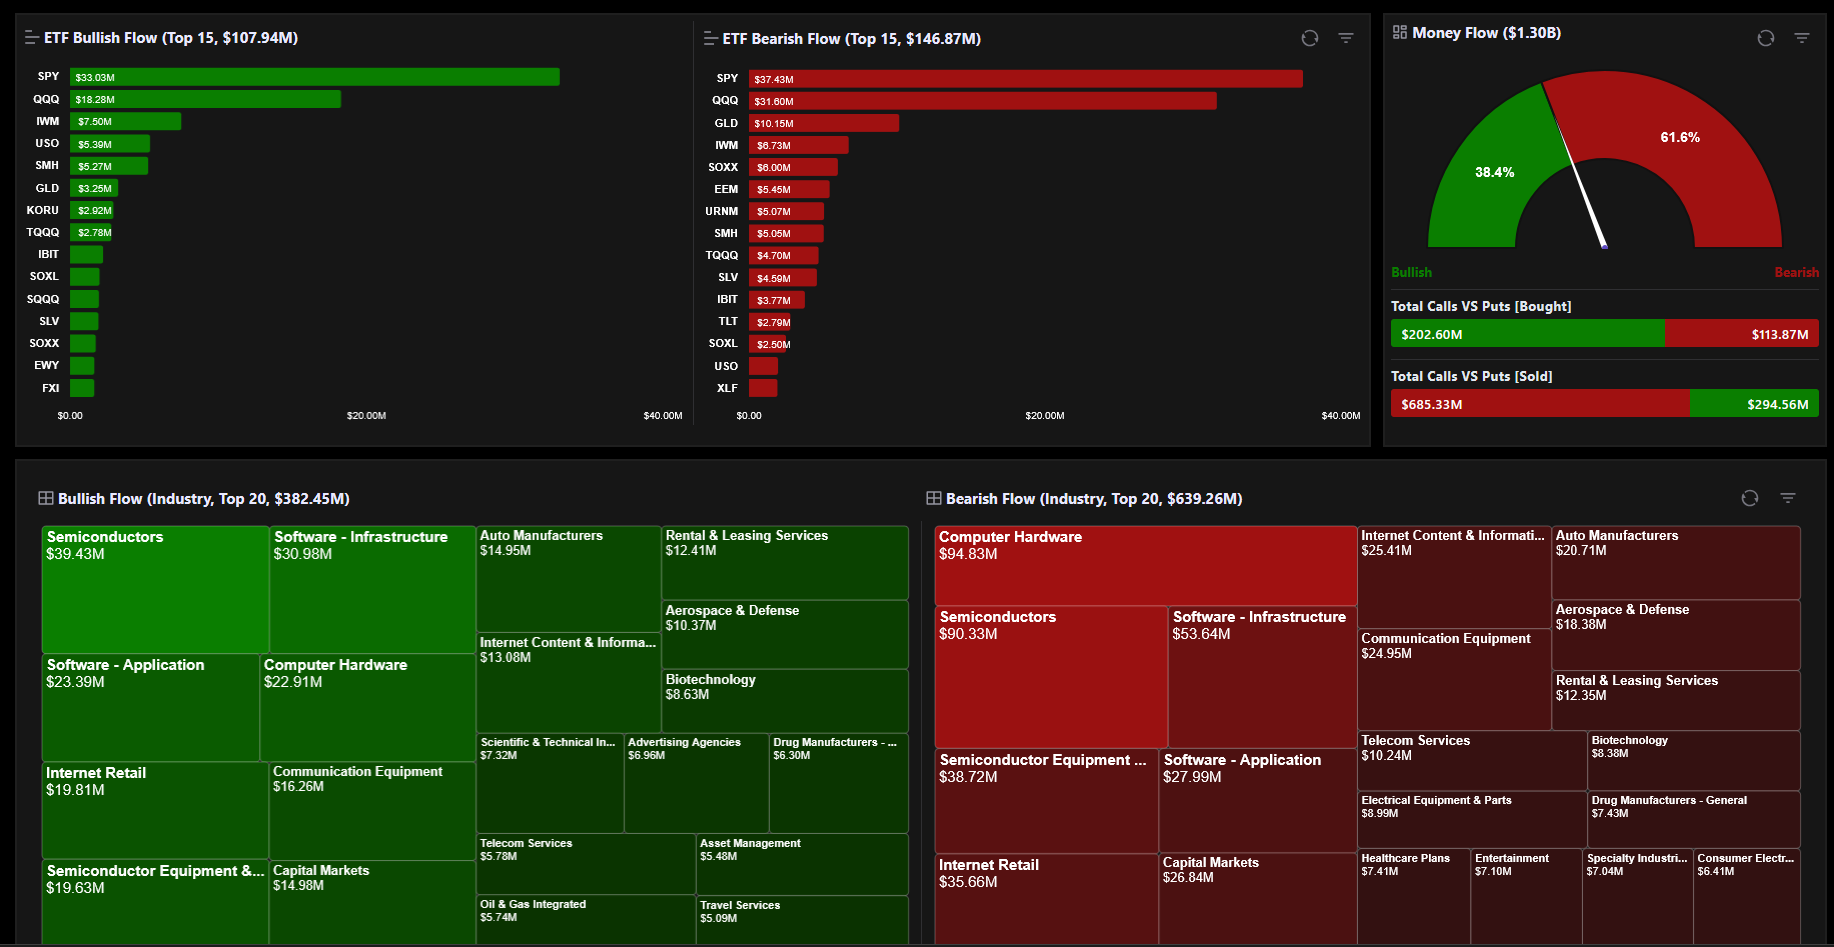
The Dashboard is the landing page of JarvisFlow that provides a high-level overview of market activity across three main sections: ETF Flow Bullish and Bearish Top 15, a Money Flow Gauge chart, and Bullish and Bearish flow on stocks grouped by Industry or Sector. Each section supports date range filtering so you can view historical activity across different time periods.
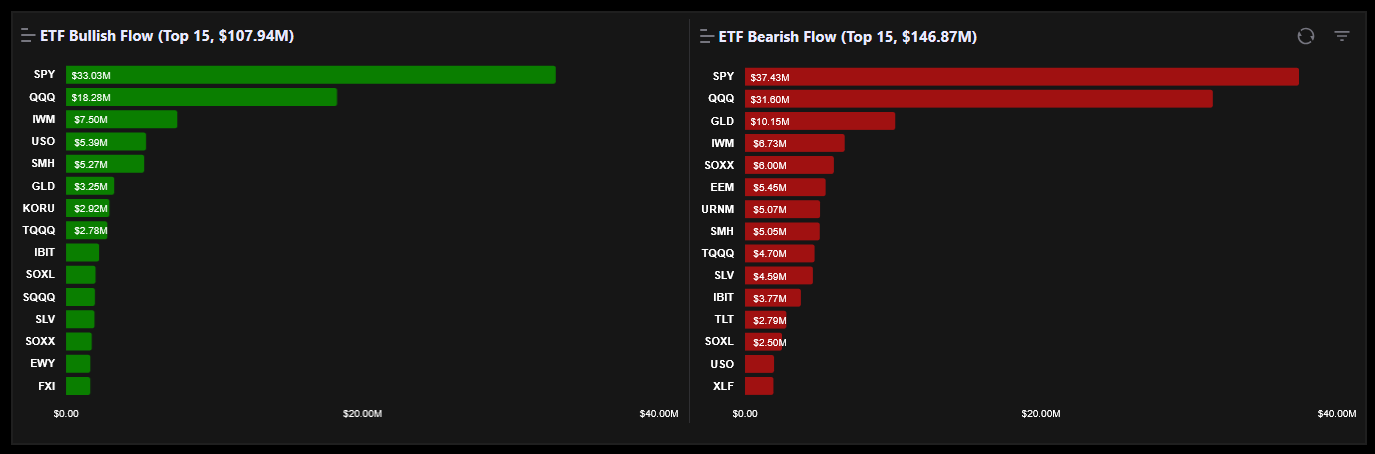
This section displays a ranked list of the top 15 most active ETF options trades split into Bullish (call) and Bearish (put) categories. Each row shows the ticker, total premium, trade count, and whether the activity is bullish or bearish. Use the date range filter above the table to view activity for specific periods.
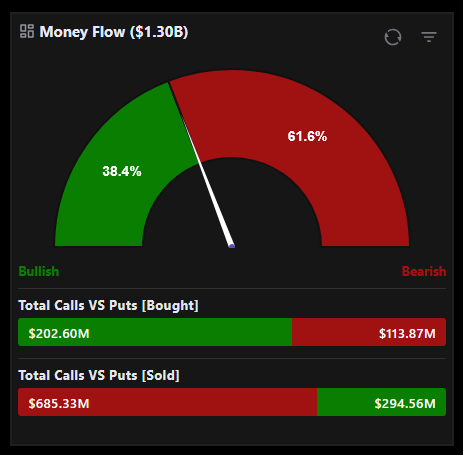
The Money Flow Gauge is a visual chart that displays the direction and magnitude of options money flow for selected assets. It provides two sets of filters: one to choose between Stocks ETFs or All asset types and another to filter by Bought Sold or All flow types. The gauge updates in real time based on your selections.
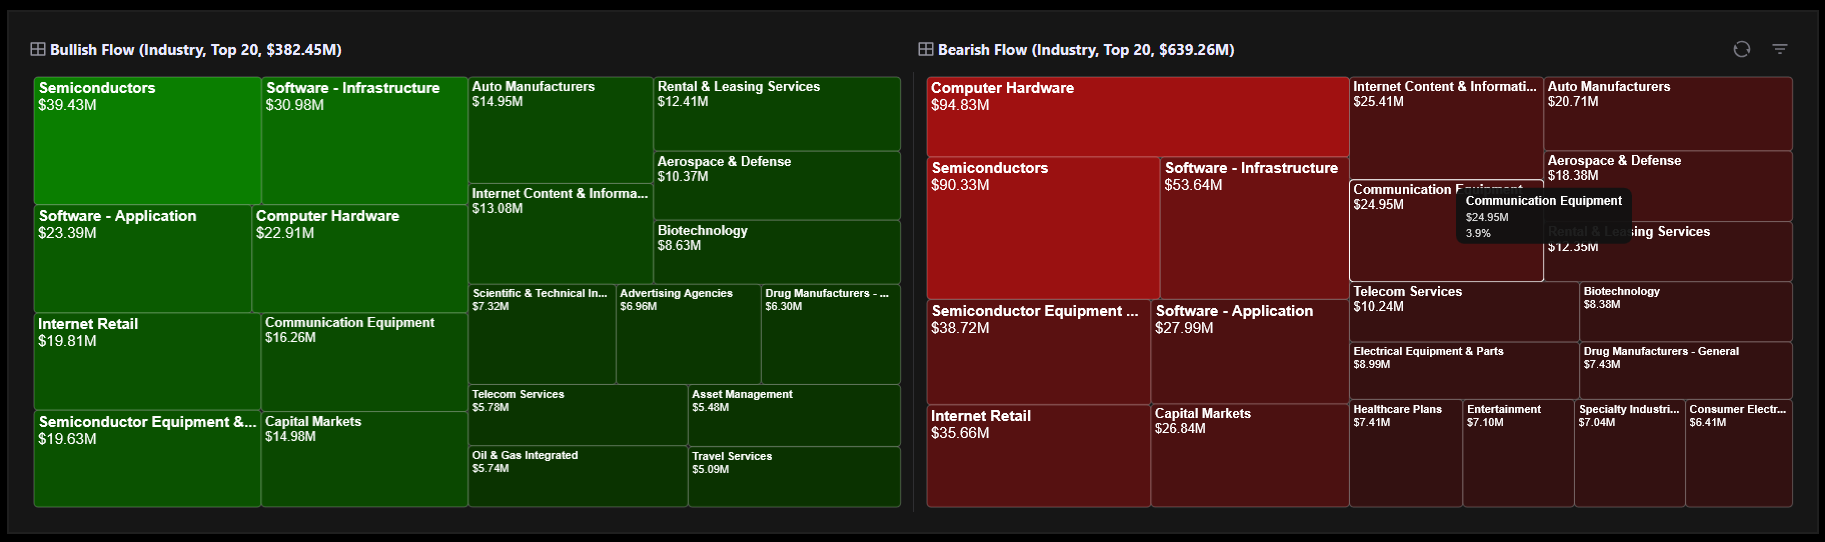
This section shows the top 20 stocks with the highest options flow activity, grouped by either Industry or Sector. You can toggle between grouping by Industry or by Sector. Each group expands to show individual stock tickers within it along with their flow metrics. Use the date range filter to see which industries or sectors have been most active over specific time periods.
Bullish flow refers to options activity that indicates positive or upward directional sentiment. This includes call options bought as well as put options sold. Bearish flow indicates negative or downward directional sentiment and includes put options bought as well as call options sold. On the Dashboard both directions are tracked and displayed separately so you can quickly identify which assets are attracting bullish versus bearish positioning.
Join our Discord community or reach out to our support team for personalized assistance